- Home
- Blog
- Web Performance
- How to measure the performance of a website?
How to measure the performance of a website?

The performance or speed of a website refers to how quickly the browser can render a fully functional web page for a given website across a variety of network conditions and devices.
Insights on our approach to measuring the performance of a website.
More information about why website performance matters so much for brands, retailers and startups, can be found in our article about website performance.
Tools to measure the performance of a website
Lighthouse
Google Lighthouse is a Chrome extension that can be used to measure the performance of a website. For the browser based version, use Google PageSpeed Insights.
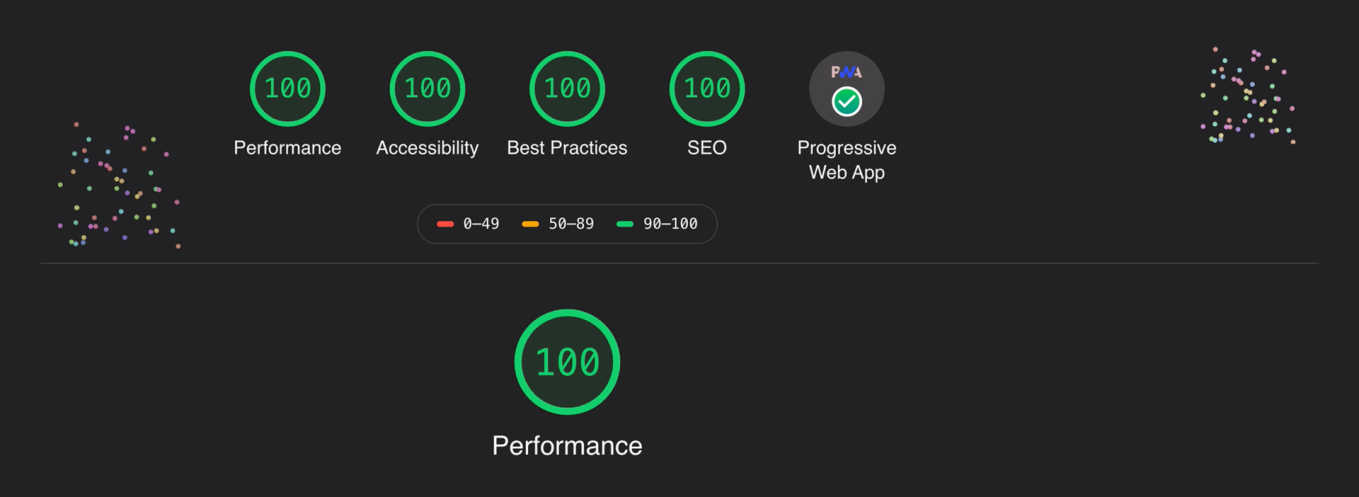
Google Lighthouse reports measure a website:
Performance - how fast is the website?
Accessibility - is the website accessibility optimal?
Best Practices - are the web development best practices implemented correctly?
SEO - is the website optimised for SEO?
PWA badge - is the website a valid PWA?
Here is an example of a Google Lighthouse report with perfect score we recently delivered on a client website:

Other tools provided by Google that can be used to measure and compare the performance of a website: Web Dev Measure - Similar to Page Speeds Insights Compare a site performance on mobile - To compare the mobile performance of a site
Pingdom website speed test
Pingdom Website Speed Test tool analyses the performance of a website from different locations and assigns a performance grade. It measures the page size, page load time and number of requests, and provides suggestions to improve the performance.
Page Load Speed: Key Concepts
The page load speed is based on six key metrics:
First Contentful Paint - Measure of the gradual page rendering and perceived wait time
Speed Index - How quickly the contents of a page are visibly populated
Time to Interactive - Measure the time it takes for interactions to work
First Meaningful paint - When the main content of the page is visible
First CPU idle - When the page is quiet enough to handle input
Max potential first input delay - Duration of the longest task
Time to first byte
When a website is loaded, a request is made to the server. The time to first byte is the time it takes for the server to send an initial response. This metric is an indicator of the server performance.
First Contentful paint
When a website page loads, elements are rendered gradually on the screen. The first contentful paint metric measures the time it takes for any part of the page content (text, images, background images etc.) to be rendered on the screen. This metric is an important user-centric metric as it affects the perceived wait time (see below). More info about this metric on Google Dev website (https://web.dev/fcp/)
Time to interactive
The time to interactive measures how long it takes for page to become fully interactive. A page is considered interactive when it displays useful content and when buttons and user interactions are functional. Measuring the time to interactive is important because some sites optimize content visibility at the expense of interactivity. This can create a frustrating user experience: the site appears to be ready, but when the user tries to interact with it, nothing happens.
Actual wait time vs perceived wait time
The notion of perceived wait time can be defined by how long the wait feels (by opposition with the actual wait time which is the actual wait time). The perceived wait time can be improved by working on the First contentful paint metric. Pinterest increased search engine traffic and sign-ups by 15% when they reduced perceived wait times by 40%.
Read more
The main technical optimisations techniques are covered in our website performance optimisation article.


