
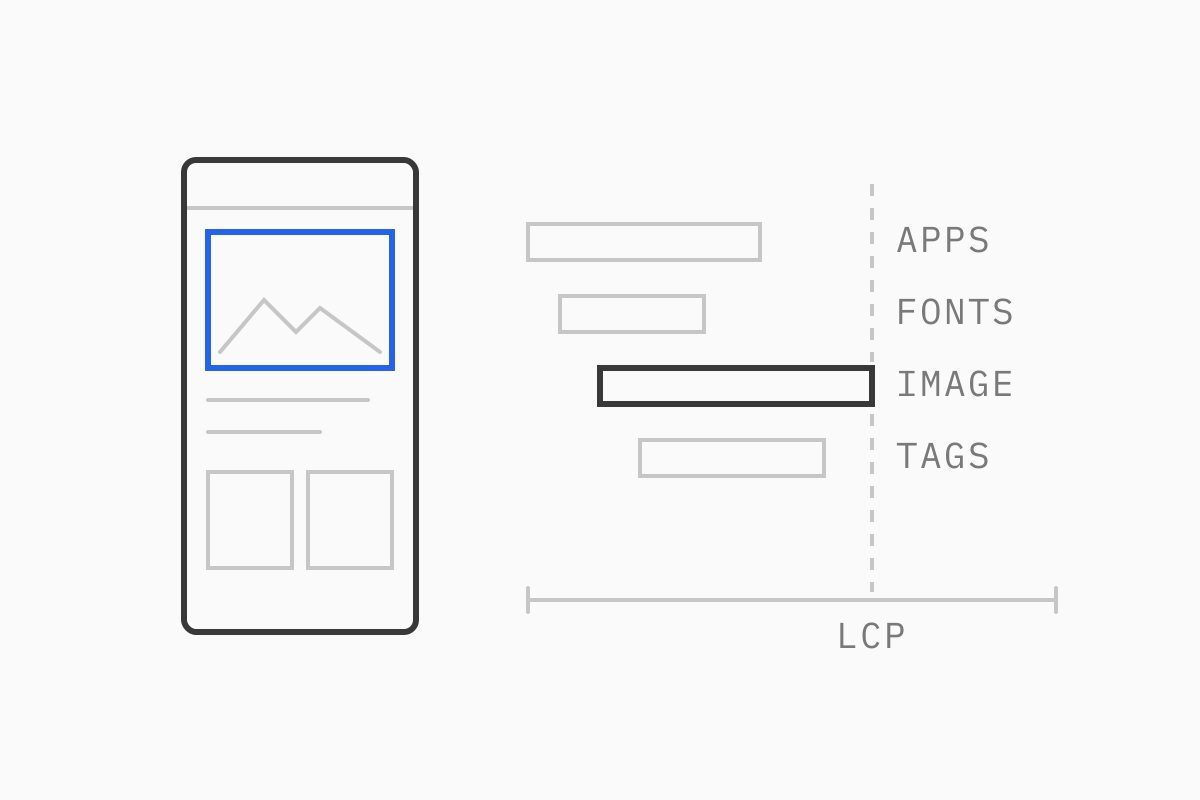
01Why site speed matters for an eCommerce business
Speed is a revenue question before it’s a technical one. The most useful evidence comes from controlled tests where one group of shoppers saw a faster page and another saw the original:
Rakuten 24 split traffic 50/50 for a month between an optimized landing page and the original. The optimized page showed 53.37% more revenue per visitor and a 33.13% higher conversion rate. The work was ordinary: removing render-blocking resources, lazy-loading below-the-fold images, reserving space to stop layout shifts, and serving images through a CDN (web.dev case study).
Vodafone A/B tested a landing page with a 31% faster Largest Contentful Paint. The faster version produced 8% more sales (web.dev case study).
Deloitte’s “Milliseconds make millions” study, commissioned by Google, looked at mobile sites of brands in Europe and the US. For retail, a 0.1-second improvement in mobile speed was associated with 8.4% more conversions and a 9.2% higher average order value (Deloitte).
Treat those numbers as direction, not a forecast: your uplift depends on how slow you are today and how much traffic is on mobile.
Speed also feeds search: Google says Core Web Vitals line up with what its core ranking systems reward (Google Search Central). It’s one signal among many.
02How to measure eCommerce site speed
Older guides list Lighthouse metrics such as First Meaningful Paint, First CPU Idle and Time to Interactive, all since retired. Measurement now starts with three Core Web Vitals and one distinction: field data versus lab data.
Field data and lab data
Field data is what real customers experienced on their own phones and networks. It’s what Google uses and what reflects revenue, but it’s slow to react (Google’s CrUX dataset covers a rolling 28 days) and tells you what is slow, not why.
Lab data comes from a controlled test such as Lighthouse. It’s repeatable and gives a detailed diagnosis, so it’s the right tool for debugging and pre-release checks. But it’s one device on one simulated connection: a store can score 90 in Lighthouse and still fail Core Web Vitals in the field.
Use field data to decide what to fix, lab data to work out how.
Core Web Vitals and current thresholds
Google assesses each metric at the 75th percentile of page loads, separately for mobile and desktop (web.dev).
Metric | What it measures | Good | Poor |
|---|---|---|---|
Largest Contentful Paint (LCP) | When the main content, usually the hero or product image, appears | 2.5 s or less | Over 4 s |
Interaction to Next Paint (INP) | How quickly the page reacts to taps, clicks and key presses | 200 ms or less | Over 500 ms |
Cumulative Layout Shift (CLS) | How much content jumps around as it loads | 0.1 or less | Over 0.25 |
INP replaced First Input Delay (FID) as a Core Web Vital on March 12, 2024 (web.dev). FID measured only the first interaction; INP looks at every interaction in the visit, which is much harder to pass on a store loaded with scripts. If an old report still shows FID, ignore it.
First Contentful Paint (FCP) isn’t a Core Web Vital but is a useful diagnostic: good is 1.8 seconds or less, poor is over 3 seconds (web.dev). A slow FCP usually points to a slow server response or render-blocking CSS and JavaScript, which also delay LCP.
The tools we use
Shopify’s web performance report. A summary sits on the Themes page in the admin, with full reports under Analytics > Reports. They show LCP, INP and CLS from real visitors at the 75th percentile, by page type, URL and device, with annotations when an app is installed or the theme changes (Shopify Help Center). Those annotations let you tie a drop to a specific change. The report replaced Shopify’s old Lighthouse-based speed score in 2024 (Shopify Performance blog).
Google Search Console, Core Web Vitals report. CrUX field data, grouped by similar URLs. A group takes the status of its worst metric, and after a fix you can start a 28-day validation (Search Console Help).
PageSpeed Insights. CrUX field data for the URL (or the whole origin if traffic is low) plus a Lighthouse lab run on a simulated mid-tier phone (PageSpeed Insights docs).
Chrome DevTools. The Performance panel shows live LCP, CLS and INP as you use the page, can pull in CrUX data for comparison, and throttles CPU and network to match a mid-range phone (Chrome for Developers). Most of our diagnosis happens here.
Shopify Theme Inspector for Chrome. Shows which lines of Liquid take longest to render on the server (shopify.dev).
03The fixes that matter most on Shopify
Shopify already provides a global CDN, HTTP/3, Brotli compression and automatic image format selection (shopify.dev), so server-level advice from older guides rarely applies. The problems on a slow Shopify store are almost always in what’s been added on top.
Apps and third-party scripts
We look here first. Every storefront app (reviews, upsells, chat, popups, loyalty) ships its own JavaScript, often on every page whether it’s used there or not. Shopify requires App Store apps not to reduce storefront Lighthouse scores by more than 10 points (shopify.dev), but 10 apps that each cost a few points add up, and a Lighthouse score says nothing about INP on a real phone.
List every script on the page and match it to an app and an owner. Anything without an owner goes.
Check theme files for code left behind by uninstalled apps.
Defer what the customer doesn’t need in the first second, such as reviews and analytics, as Shopify’s own guidance suggests (Shopify Help Center).
Load product-page apps only on product pages.
Removing an app is a business decision, so we take the list to whoever owns each tool.
Images and LCP image priority
On most product and home pages, the LCP element is an image, so this is usually the answer to how to improve Largest Contentful Paint. Google splits LCP into server response, the delay before the image starts loading, the download, and the delay before it renders, and wants almost all the time spent on the first and third (web.dev). The common mistakes all add delay:
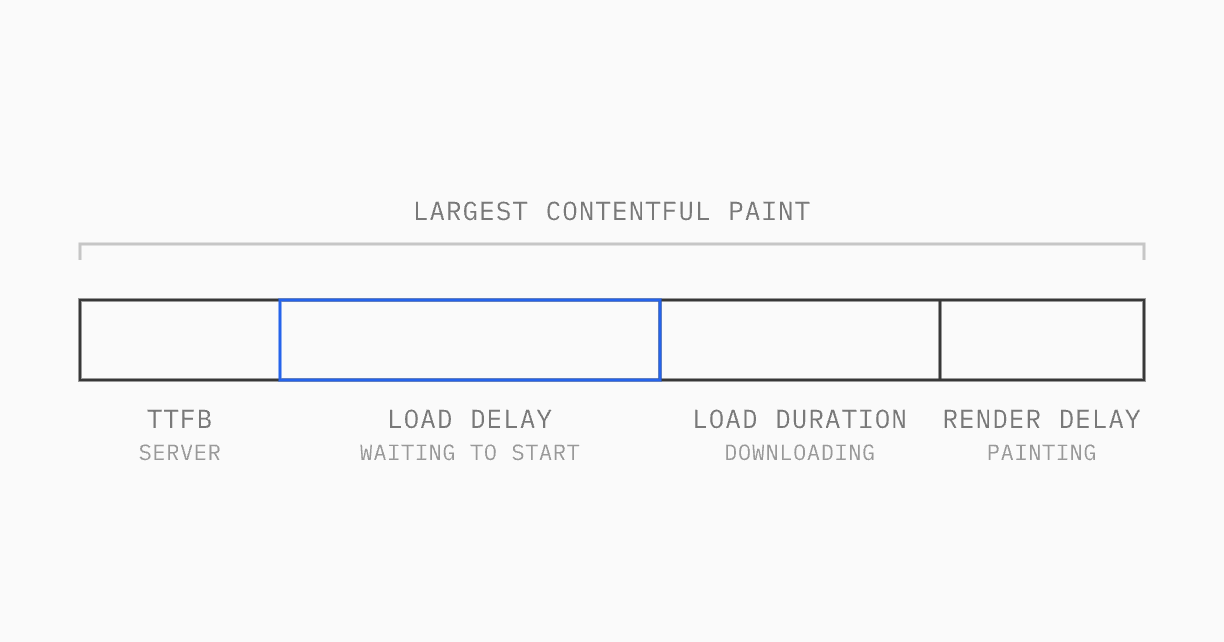
Lazy-loading the hero image. loading="lazy" belongs below the fold, never on the LCP image. Many themes apply it to every image.
No priority hint. Add fetchpriority="high" to the LCP image (shopify.dev).
Hero images as CSS backgrounds. The browser can’t discover them until the CSS loads. Use an
<img>tag.Fade-in animations on the hero. LCP waits for the transition.
Oversized files. Use the image_url and image_tag filters to generate srcset and sizes. Shopify’s CDN serves WebP or AVIF automatically (shopify.dev), so converting to WebP by hand is no longer needed.
Set width and height (or a CSS aspect-ratio) on every image so the browser reserves space. Missing dimensions are a common cause of poor CLS (web.dev).
The most common image bottleneck on client builds starts before any code: teams upload huge files. On our builds, we agree on an image spec per placement so images are sized for the web without visible loss of quality, and add server-side optimization so the browser can render them quickly.
Above-the-fold sliders
Homepage carousels often hold the LCP image and load slides with JavaScript, which hides the image from the browser until the script runs. Google’s guidance is to render slides in HTML, animate with CSS transforms, and measure click-through to see whether the carousel is worth keeping (web.dev). A single, well-chosen hero image usually does the same job with less code. If you’re unsure, A/B test it on your Shopify store.
Fonts
Custom fonts delay text and shift the layout when they swap in. Self-host fonts on Shopify’s CDN rather than an external font service, preload only the one or two used above the fold, and use font_display (a parameter of the font_face filter) with metric overrides such as size-adjust so the fallback takes up the same space (shopify.dev). Cut weights too: four weights of two families is eight files.
Theme code and Liquid
A slow server response delays everything after it, including FCP and LCP. On Shopify the usual cause is Liquid doing too much work: nested loops, metafields read inside loops, or every variant of every product loaded on a collection page. Shopify names nested loops as the most common cause of a high Time to First Byte (shopify.dev).
In the browser, the classic advice still holds: defer non-critical JavaScript, keep critical CSS small, and render main content with Liquid rather than in JavaScript. The difference now is that heavy JavaScript shows up in INP, because a busy main thread delays every tap on “Add to cart” (web.dev).
In our audits, the most common theme problem is legacy JavaScript: older themes ship with jQuery and similar libraries, and apps often load outdated versions of their scripts. The cleanup is usually removing unused apps, upgrading the rest and the scripts they rely on, and rewriting the theme code that leans on old libraries.
Tag managers and tracking
Google Tag Manager containers grow quietly: each campaign adds a tag and nobody removes the old ones, yet every tag competes with the code that responds to taps. Audit the container with the marketing team, remove tags for tools you no longer use, and look for duplicates such as the same pixel installed through an app and GTM.
Shopify’s Customer Events runs marketing pixels in a sandbox rather than directly in the page (shopify.dev). Moving tracking there is worth considering, but check with whoever owns attribution first, because sandboxed pixels can’t access everything.
Video
Background video is heavy. If you keep it, don’t make it the LCP element, give it a light poster image, and lazy-load anything below the fold. Shopify’s video_tag filter supports loading, autoplay, muted and a poster image_size (shopify.dev). For YouTube or Vimeo embeds, show a static thumbnail and load the player on click.
04Headless storefronts: speed is in your own code
On a headless storefront, Shopify still runs the catalog and checkout, but the front end is your own application: server rendering, caching, image handling and bundle size are your developers’ decisions.
Done well, a headless front end can be fast, because nothing loads that you didn’t choose. Done badly, it ships a large JavaScript bundle that must run before the page responds, which is what INP punishes. We built Kimai as a headless storefront with a React front end on Shopify Plus, with Contentful for content and Algolia for search, and Ever/Body on Next.js and Contentful. On builds like these, performance is designed in from the start, and the image spec matters even more because no theme handles images for you.
Going headless purely for speed is usually the wrong call. A Shopify theme with lean apps and scripts can pass Core Web Vitals comfortably and is cheaper to keep fast. Headless makes sense when you need something a theme can’t do; we cover that trade-off in headless vs Shopify theme.
05How to keep it fast
Stores rarely get slow in one go. They get slow one app, one tag and one homepage section at a time, so speed has to be part of how changes ship.
Set a performance budget. A budget is a limit the team agrees not to cross. Google describes three kinds: quantities (JavaScript size, image weight, number of fonts), timings (LCP, FCP) and rule-based scores such as a minimum Lighthouse score (web.dev). For a Shopify store, we’d start with Core Web Vitals targets per page type plus a cap on third-party scripts.
Check before each release. Shopify’s Lighthouse CI GitHub Action audits the home, product and collection pages on every pull request and fails below a minimum score you set (shopify.dev). It’s lab data, so it won’t catch everything, but it stops obvious regressions.
Treat new apps like code. Test each app on a duplicate theme before installing, then watch its annotation in Shopify’s web performance report for the following week.
Review field data monthly, by page type and device. Mobile product pages are usually where the money and the problems are.
06Where to start
This week, open Shopify’s web performance report, find the page type with the worst mobile LCP or INP, and run it through Chrome DevTools with CPU throttling on. The cause often shows up within an hour: a lazy-loaded hero, an app script on every page, or a tag nobody remembers adding.
If you’d like a second opinion, our developers run performance audits as part of our Growth services: a review of your store’s performance and Core Web Vitals, with a prioritized list of fixes. We can then make those fixes through our Shopify development work.
07FAQ
How do I speed up my Shopify site?
Start with Shopify’s web performance report to see which Core Web Vital fails on which page type. Then work through the usual causes: remove unused apps and leftover app code, stop lazy-loading the hero image and add fetchpriority="high" to it, cut fonts and tracking tags, and fix slow Liquid. Test each change on a duplicate theme before publishing.
How do I improve Largest Contentful Paint on Shopify?
Find the LCP element (usually the hero or main product image) in PageSpeed Insights or Chrome DevTools. Make sure it’s an <img> tag in the HTML, not lazy-loaded, not hidden behind an animation, sized with srcset, and marked fetchpriority="high". If the server response is slow, profile the theme’s Liquid with Shopify Theme Inspector.
How do I fix First Contentful Paint?
A slow FCP usually means the browser is waiting on the server or on render-blocking CSS and JavaScript. Reduce server response time (on Shopify, simplify heavy Liquid), defer non-critical scripts, keep critical CSS small, and make sure web fonts don’t block text from showing. Good FCP is 1.8 seconds or less.